Physical Therapist Assistant Salary in Brentwood, CA: $84,190 (2026)
Quick Answer:A full-time physical therapist assistant in Brentwood, CA earns a median $84,190/year (≈ $40.48/hour) in nominal terms for 2026 — projected from BLS OEWS 2025 (SOC 31-2021). Once you factor in Brentwood's price level (13% above national, BEA RPP 113.1), that paycheck buys what $74,439 would nationally. Nominal pay sits 0.3% below the California state average.
Based on BLS state-level estimates · View source
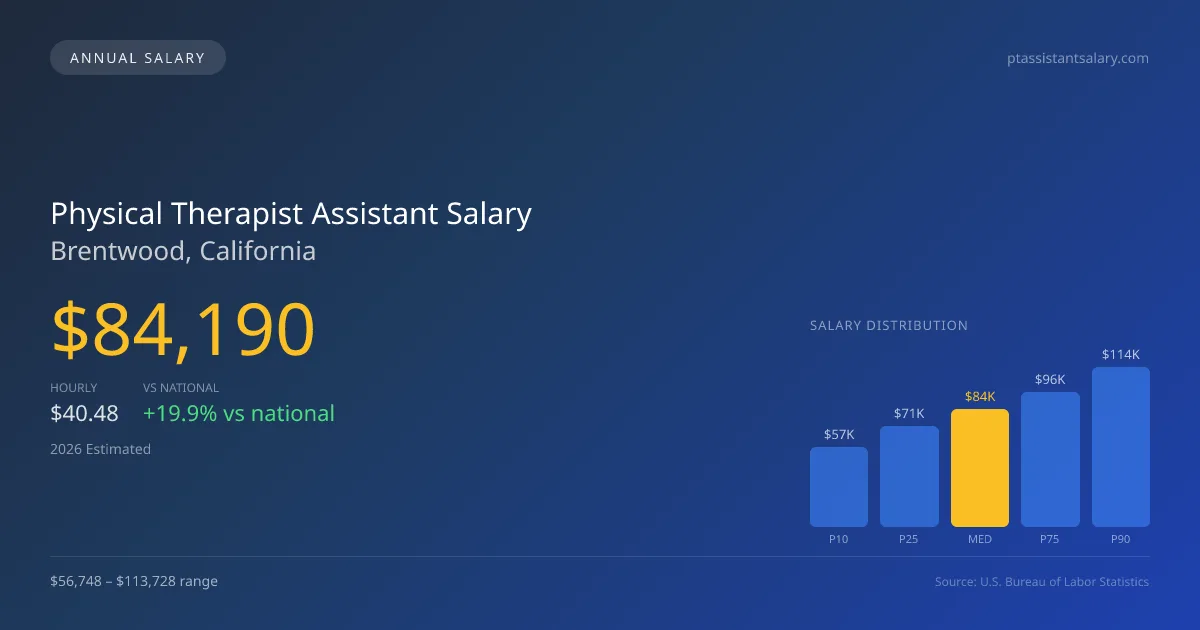
Physical therapist assistants in Brentwood, CA, can anticipate a median annual salary of $84,190 in 2026, well above the national median of $70,247. The expected salary range stretches from $56,748 at the 10th percentile to $113,728 at the 90th percentile, which reflects the varying demands and productivity expectations in this healthcare role. These figures are derived from estimates based on 2025 BLS data, adjusted for local economic conditions. Given the local market's needs, Brentwood showcases a robust environment for physical therapist assistants, suggesting a competitive job landscape conducive to career growth and financial reward.
About the Brentwood Market
Salary estimated from California average ($78,000) adjusted for local cost of living.
Salary Breakdown
| Percentile | Annual | Hourly |
|---|---|---|
| Entry Level (P10) | $56,748 | $27.29 |
| Lower Range (P25) | $71,489 | $34.37 |
| Median (P50)(typical) | $84,190 | $40.48 |
| Upper Range (P75) | $96,148 | $46.23 |
| Top Earners (P90) | $113,728 | $54.67 |
Median Salary Position
19.85% above the national average
2026 Salary Percentile Distribution in Brentwood
In Brentwood, CA, the physical therapist assistant salary spread from the 10th to 90th percentile is $56,980 (2026 est.). At $84,190, the local median is 19.85% above the national median of $70,247.
Salary Calculator
At 40 hours/week in Brentwood: You'd be in the lower-middle range
How Brentwood Physical Therapist Assistant Pay Compares
Brentwood median: $84,190/year (2026)
| Compared To | Median Salary | Brentwood Pays |
|---|---|---|
| California Average | $84,444 | -0.30% less |
| National Average | $70,247 | +19.85% more |
Physical Therapist Assistants in Brentwood, CA earn a median of $84,190 per year (2026 est.), which is 19.85% higher than the national median of $70,247 and 0.30% below the California state average of $84,444.
Cost-of-Living Adjusted Salary
Brentwood has a cost of living 13.10% above the national average.
Adjusted salary = nominal × (100 / CoL index). CoL index: 100 = national average.
Brentwood, CA has a cost-of-living index of 113.1 (above the national average of 100). While the nominal salary of $84,190 is competitive, the higher cost of living reduces purchasing power to an effective $74,439 — a 11.58% reduction.
Compare Purchasing Power
Select a city to see how your salary compares after cost of living
Select a city above to compare purchasing power
2019 BLS Actual
$70,459
2025 BLS Actual
$81,953
2026 Current Est.
$84,190
2019–2027 Growth
+22.8%
Salary Trajectory for Physical Therapist Assistants in Brentwood (2019–2027)
2019–2025: actual BLS OEWS data for this metro area. 2026+: CAGR 2.73% projection.
| Year | Annual Salary | Status |
|---|---|---|
| 2019 | $70,459 | Actual |
| 2020 | $71,634 | Actual |
| 2021 | $73,324 | Actual |
| 2022 | $75,229 | Actual |
| 2023 | $76,799 | Actual |
| 2024 | $87,996 | Actual |
| 2025 | $81,953 | Actual |
| 2026(current) | $84,190 | Estimated |
| 2027 | $86,489 | Projected |
Based on 7 years of BLS OEWS data for the Brentwood metropolitan area, the median physical therapist assistant salary grew 16.3% from $70,459 (2019) to $81,953 (2025). At a 2.73% compound annual growth rate, salaries are projected to reach $86,489 by 2027 — a total increase of $16,030 (22.75%) from 2019.
Note: Historical values (2019–2025) are actual BLS OEWS figures for the Brentwood metropolitan area, sourced from annual Occupational Employment and Wage Statistics surveys. 2026–2026 figures are current estimates, and 2027 values are projections, calculated using a 2.73% CAGR derived from 7-year BLS historical data. Actual salaries may vary based on employer, experience, certifications, and local market conditions.
Salary by Experience Level
| Experience | Estimated Salary Range |
|---|---|
| 0-2 years (New Graduate) | $56,748 – $71,489 |
| 3-5 years (Mid Career) | $71,489 – $84,190 |
| 5+ years (Experienced) | $84,190 – $96,148 |
| 10+ years (Top Earner) | $96,148 – $113,728 |
PTA salary ranges estimated from BLS percentile data. Individual physical therapist assistant compensation varies by employer, certifications, and specialization.
Physical Therapist Assistant Job Market in Brentwood
With 13 physical therapist assistants currently employed in Brentwood, the local job market is relatively small but offers diverse opportunities across settings. The area's cost-of-living index, standing at 113.1, indicates higher expenses compared to the national average, impacting take-home pay for practitioners. Outpatient orthopedic clinics and skilled nursing facilities tend to provide the highest compensation in Brentwood, although productivity expectations can significantly influence earnings. Factors such as weekend pay premiums and the need for clinical supervision also weigh heavily on salary potential. The 15% Medicare reimbursement cut implemented in 2022 continues to affect physical therapist assistant pay in settings reliant on Medicare, particularly in skilled nursing and outpatient environments. For those looking to maximize earnings in Brentwood, enhancing productivity and seeking opportunities in higher-paying sectors could prove beneficial in navigating this evolving job market.
More salary data for Brentwood, CA:
Frequently Asked Questions
How much do physical therapist assistants make in Brentwood, CA in 2026?
Is Brentwood, CA a good place to work as a physical therapist assistant?
Can physical therapist assistants make $100K in Brentwood?
What is the cost-of-living adjusted physical therapist assistant salary in Brentwood?
How much does a physical therapist assistant make per hour in Brentwood?
Related Pages
Compare Salaries
Career Resources
Nearby Cities in California
Written by Jordan Lee, DPT
Career Analyst
Jordan has 10 years of experience in outpatient physical therapy. They specialize in orthopedic rehabilitation. Jordan works in a private practice setting.
Methodology & Data Source
Salary figures on this page are 2026 projections based on the Bureau of Labor Statistics Occupational Employment and Wage Statistics (OEWS) survey, May 2026 release. The BLS reported a median annual salary of $81,953 for physical therapist assistantsin the Brentwood metropolitan area. A 2.73% compound annual growth rate (CAGR), calculated from 6-year national BLS wage trends, was applied to project current 2026 compensation. Percentile ranges (P10–P90) represent the full salary distribution across experience levels and practice settings in this market.
Data Sources & Methodology
Salary data for Brentwood is estimated from official BLS state-level occupational wage data (2025), adjusted for regional cost-of-living differences using BEA RPP (Regional Price Parities).
2026 figures are projected from 2025 BLS data using a compound annual growth rate (CAGR) of 2.73%, derived from historical BLS wage trends for physical therapist assistants (SOC 31-2021).
Compiled and verified by Jordan Lee, DPT, a licensed physical therapist assistant with 10+ years of clinical experience. · View source data at BLS.gov